
Introduction to Trading Discipline
Successful traders can be classified as people who have been consistently profitable over a long period of time. The ability to take money out of the markets month in and month out requires extreme discipline and patience. People who enter the world of online trading should always remember that trading is a very competitive business and that they will be competing against some of the sharpest minds in the world.
Learning how to become consistently profitable requires a strategy that has been proven to be successful over a long period of time but no strategy will be of any use unless a trader has the discipline to follow the rules that a successful strategy requires.
All strategies will inevitably experience draw downs because no strategy has a 100% success rate and if a trader does not have the patience and trust in their strategy’s statistical performance then they are doomed to fail.
Trading too often is another mistake beginner traders make because they tend to focus too much on smaller time frames and get sucked into the world of day trading or scalping. While you can be successful doing this it really is a very difficult endeavor to pull off on a consistent basis.
The purpose of this article is to show you a strategy that requires trading discipline, patience and how to avoid trading too often.
Maintaining Trading Discipline Through Strategy
The Exponential Profits System (EPS)
After years of testing and fine tuning I have developed a strategy that aims to achieve one specific goal:
Finding the end of corrections within a trend and entering positions once the trend resumes again.
Although this goal may sound simple it does require a strategy that breaks down the process of finding the end of corrections into smaller manageable steps. Each step has its own function to achieve the final goal.
Following these steps enforces discipline and patience and prevents a trader from trading too often.
Strategy Overview
Finding the end of corrections using my strategy requires the following steps:
- Identifying trend direction and determining where a correction may appear.
- Identifying the type of correction and using market geometry techniques to determine where such a correction could end.
- Following a set of rules based entry conditions to limit risk and enter trades.
- Managing my open position until my targets are hit or my trailing stop gets taken out.
Next I will give you a quick overview of how I followed these steps on a recent trade setup in Facebook.
Step 1: Identifying trend direction and determining where a correction may appear

I use 3 timeframes when trading and the first chart that I looked at when analyzing Facebook was the 4 hour chart, from where I determined trend direction using simple trend lines. On the chart above it became clear that Facebook’s stock had nosedived below previous upward sloping trend lines (blue lines) and previous market structure (red line). This signaled a change in trend and turned my bias to the bearish side.
Next I used my Fibonacci extension ratios to figure out where a correction could appear and from experience I know that they like to form around one of the major Fib extension levels. In this example that happened at the 100% extension.
Step 2: Identifying the type of correction and using market geometry techniques to determine where such a correction could end
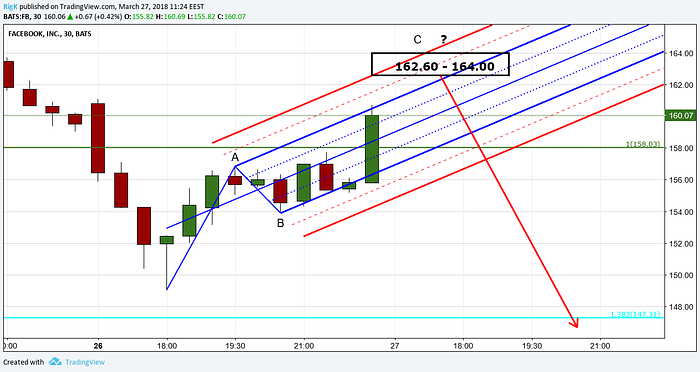
After I determined the direction I wanted to trade in and spotted a correction forming, I switched to a 30 minute chart to see what sort of correction was forming and used my trusty pitchfork to identify a trading zone where that correction could end.
I have found over the years that Schiff pitchforks work great at finding the ends of corrections especially when you have an in-depth knowledge of how different corrections look like and tend to behave.
Pitchforks are a form of market geometry and I use them extensively in my analysis.
Step 3: Following a set of rules based entry conditions to limit risk and enter trades.
Now that my trading zone was identified all I had to do was wait for price to move into that area and follow a set of entry rules/conditions before I could execute my orders.
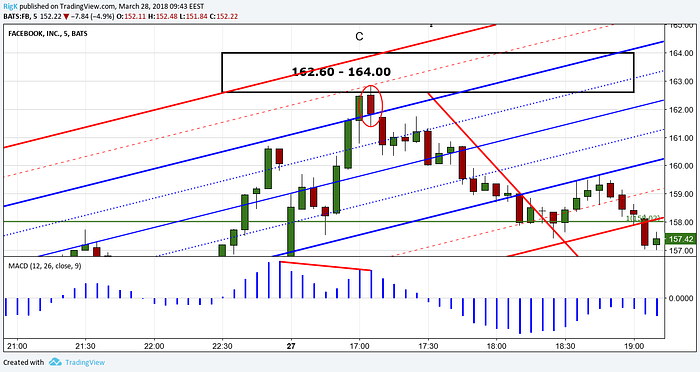
I look out for my entry conditions on a 5 minute chart and enter positions from that same chart. This allows me to limit my risk as much as possible but it also acts as confirmation that price is getting ready to reverse.
On the 5 minute chart I had a MACD-Histogram indicator loaded, which I use to spot a decrease in price momentum. My first condition therefore requires the presence of momentum divergence (red line on indicator) at an area of market geometry.
My second condition requires that I see some sort of reversal candlestick pattern after momentum divergence which should also be located at an area of market geometry (blue and red lines of pitchfork). All these conditions appeared when price entered my reversal zone and after I had a red reversal candlestick (red oval on chart) it was time to enter a sell order slightly below that reversal candlestick with a stop loss slightly above.
Step 4: Managing my open position until my targets are hit or my trailing stop gets taken out

After I got filled it was time to manage my open trades which is a big part of trading successfully. I used a downward sloping Schiff pitchfork that pointed into the direction I wanted to trade in and it allowed me to determine where I should place my targets.
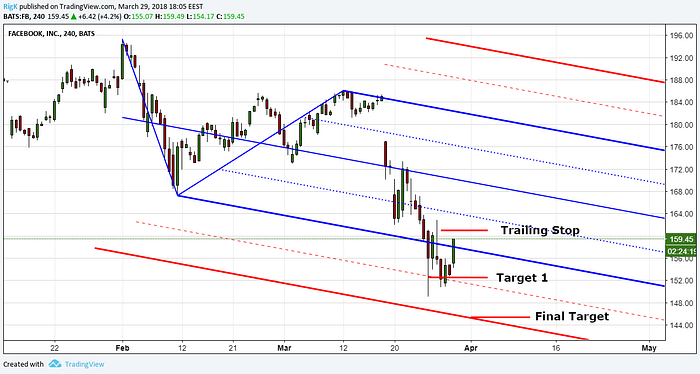
Price reached my first target very quickly after which I moved my stop loss slightly below my entry price.
At the time of writing price has not yet reached my final target and bounced upwards again. This example shows how important it is to manage an open trade properly and to never allow a profitable trade to turn into a loss.
Additional Examples
USD/CAD
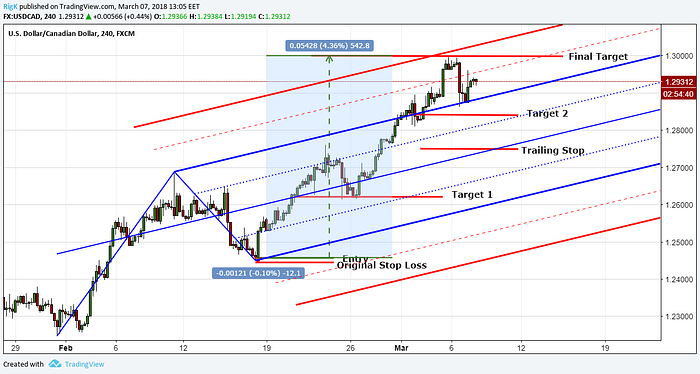
The previous example in Facebook was only a small trade but with my strategy trades like the one in USD/CAD delivered a massive return!
USOIL (Crude Oil)
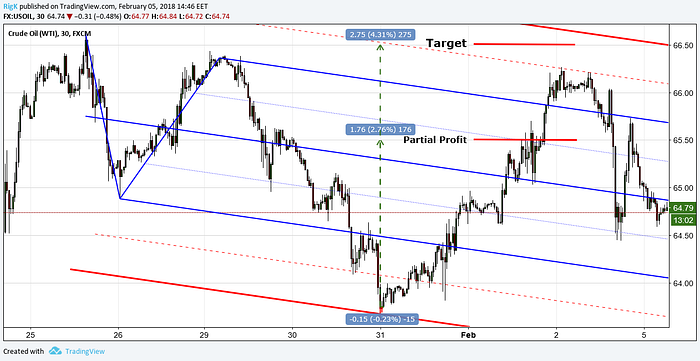
On this chart we have Crude Oil with another good return on investment.
AUD/USD

My last example for this article was in AUD/USD and when I traded that correction I did not use pitchforks but only Fibonacci retracements.
Conclusion
The examples I have used in this article were all live trades but the important thing to note here was that those trades where planned ahead of time which allowed me enough time to prepare myself for setups to appear.
Following my strategy enforced discipline and I had to be patient to wait for price to enter my trading zones before I could trade. I had a plan and when price followed my plan I executed that plan flawlessly. Trading this strategy also avoids that I trade too often because I know that I have a high success rate with my setups and I do not just trade because I feel I have to. I can afford to be picky and would rather trade less than paying the broker a lot of commission.
If you have a strategy that is consistently profitable then it becomes easier to follow it with discipline and patience because you get to trust its capabilities and performance.
If you ever wondered what it takes to achieve large winners, like the examples above, while only risking a tiny amount of your capital then be sure to check out my course here.
Consistent success in trading is possible with a good strategy that enforces trading discipline, patience in trading and avoids trading too often.
